The Stanford School of Earth, Energy & Environmental Sciences is now part of the Stanford Doerr School of Sustainability.
This page is currently being maintained for archival purposes only. For the latest information, please visit us here.

Geophysicists Jessica Reeves, Rosemary Knight, and Howard Zebker use satellite radar technology to view water buried hundreds of feet underground from hundreds of miles above. Guest appearances by Arthur C. Clarke and Cruella de Vil.
How can you see something buried hundreds of feet underground? If you answered, fly up above Earth’s atmosphere and then turn around and take pictures, you’re a crazy person. You’re also correct.
Arthur C. Clarke once quipped, “Any sufficiently advanced technology is indistinguishable from magic.” This is more or less how I feel about InSAR, the crazy space technology Stanford post-doctoral scholar Jessica Reeves and geophysics Professors Rosemary Knight and Howard Zebker used to track groundwater using satellites.
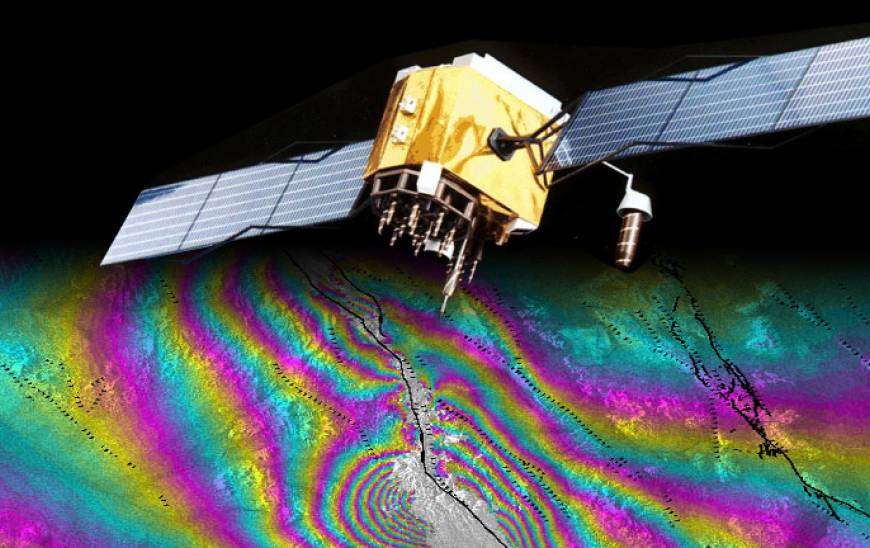
InSAR stands for Interferometric Synthetic Aperture Radar, a bunch of fancy words that mean scientists can use satellites to measure how much Earth’s surface is moving. And as technology goes, InSAR is pretty new, developed primarily in the 1990s.
Satellites fly over Earth taking radar pictures, measuring the time it takes for an electromagnetic wave to bounce off the surface and return to the satellite. Then, days, months, or even years later, the satellite returns to snap another picture. If the wave takes more time, then that spot moved farther away from the satellite. If the wave takes less time, then that spot moved closer to the satellite.
While the time differences are frequently miniscule, the process is remarkably accurate. Scientists use InSAR to measure surface changes of around 0.4 inches (1 cm). By using different colors to represent the time shift, geoscientists create interferograms, visual representations of Earth’s shifting surface and some of the most beautiful geoscience images.
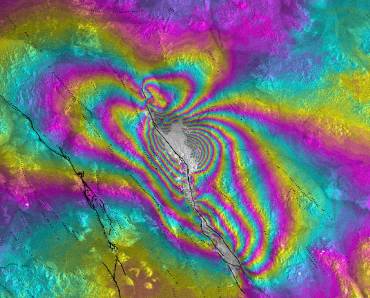
Also, some of the trippiest. Interferogram of the ground movement following the Hector Mine earthquake in 1999. Color bands are analogous to elevation contours. Image best enjoyed while eating a burrito and listening to Dark Side of the Moon (courtesy of NASA/JPL).
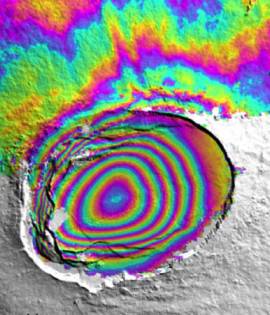
Interferogram preceding eruption of Sierra Negra volcano in the Galapagos, October 2005. Staring at this image long enough might result in awesomeness-induced vertigo (courtesy of Paul Segall).
The concentric circles are somewhat analogous to lines on a topographic map showing landscape elevation, and indicate that the ground beneath the Sierra Negra volcano was swelling with magma long before the eruption. Geoscientists frequently use interferograms to measure how the Earth’s surface changes preceding or following events like earthquakes or volcanic eruptions, or to make a mask with horrifying Cruella de Vil eyes.

"You're welcome" -my nightmares
“But Miles,” I hear you say. “That’s Earth’s surface, and you said that people can see underground using InSAR?” Yes. This is where that “sufficiently developed technology” and that “magic” stuff come in.
Reeves, Knight, and Zebker built on the fact that the ground swells and contracts like a balloon as water moves through the underlying rock. In this case, the balloon is several miles wide and only moves a few inches, but that’s more than enough to register on these little satellite wonder-machines.
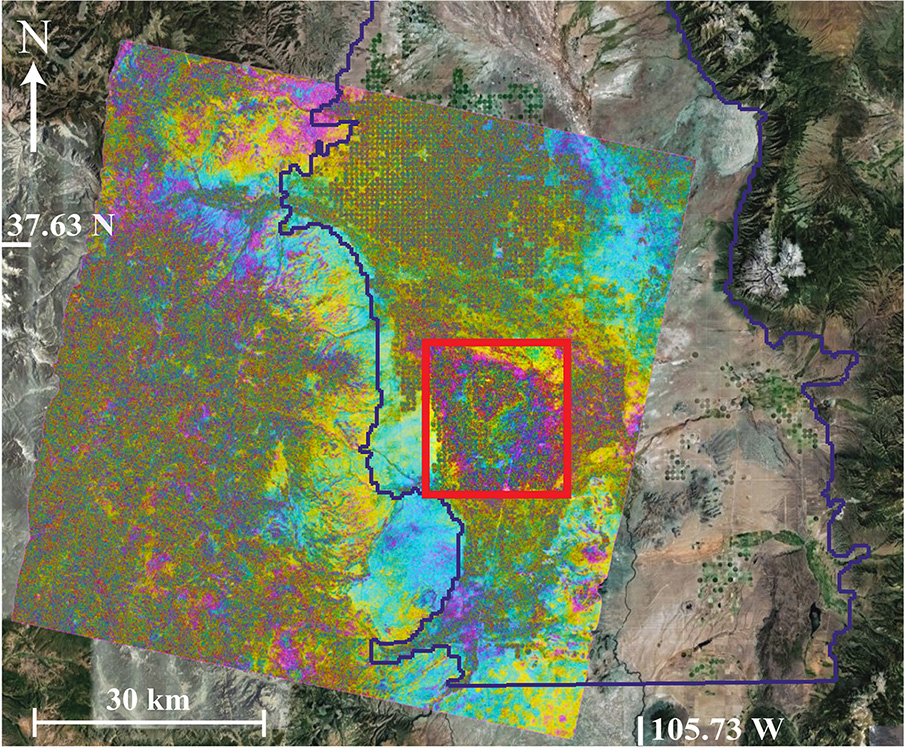
Behold! This is what science looks like. Interferogram of San Luis Valley in Colorado, USA (courtesy of Jessica Reeves)
Reeves, Knight, Zebker and their collaborators looked to Colorado’s San Luis Valley, a region that commonly extracts groundwater for agriculture. Using radar images collected from November 1999 to July 2000, they discovered a large area that had slumped down like a deflating balloon (area within the red box above), identified primarily by the circular pink/purple band and less well-defined concentric green and yellow bands in the InSAR image. These concentric bands strongly suggested ground subsidence due to the removal of water hundreds of feet below the surface.
Reeves and her team compared their InSAR measurements to other measurements made in groundwater wells across the region. They were able to correlate the ground subsidence to extraction of groundwater. In short, they were able to track groundwater movement from space.
And do it without resorting to extreme solutions such as cutting Earth open like a giant cantaloupe (image by Miles Traer).
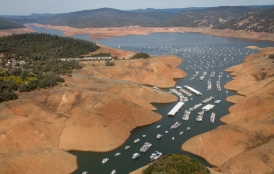
Worldwide, groundwater accounts for a quarter to nearly half of all drinking water, and depending on where you live, it might be as high as 100 percent of your drinking water. In the United States, seventy percent of all withdrawn groundwater goes to agriculture. Yet these precious fresh water sources are often poorly managed and rapidly extracted due to a lack of knowledge of where the water travels underground, and how much was there to begin with.
Until now, water managers had to track groundwater with local wells that provided sparse data and required significant resources to drill and maintain. InSAR data help fill the significant gaps between wells and allow scientists to track water moving hundreds of feet underground over much larger areas than previously possible. With continued development, this technology might allow for better groundwater management and help sustain freshwater resources for human consumption and irrigation.
So, how do you see something buried hundreds of feet underground? You use space-faring, light-bending, time-measuring, Mardis Gras-color-inducing, sufficiently-developed-Arthur-C-Clarke technology. And you’re not (that) crazy.
-Jessica Reeves recently completed her post-doctoral work in Stanford's School of Earth Sciences.
-Rosemary Knight is George L. Harrington Professor in the Stanford School of Earth Sciences and a Senior Fellow, by courtesy, at the Woods Institute for the Environment.
-Howard Zebker is a professor of Geophysics and Electrical Engineering at Stanford University.


© Stanford University, Stanford, California 94305. Copyright Complaints