| Search | | People | | Calendar | | Internal Resources | | Home |

Crustal Deformation and Fault Mechanics |
 |
|
|||||||||
|
|
||||||||
|
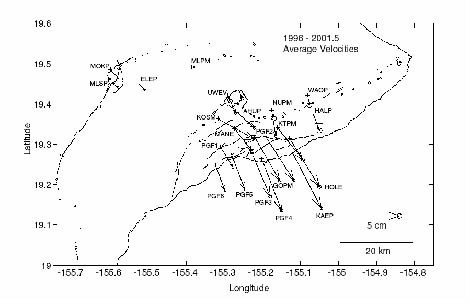
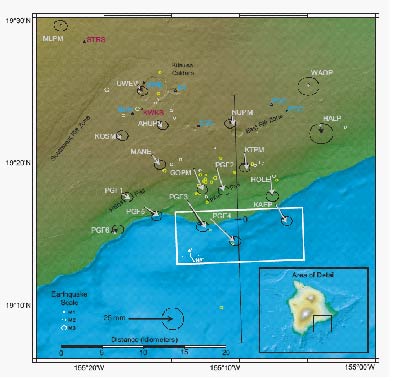
Deformation of Kilauea Volcano, HawaiiWe have developed a continuous Global Positioning System (GPS) network on Kilauea volcano, in collaboration with the U.S.G.S. Hawaiian Volcano Observatory (HVO), to better understand volcanic and seismic sources of deformation. These data provide unparalleled information on the state of the volcano and have formed the basis for a number of scientific investigations listed below. Figure 1 shows the average station velocities (1996-2001.5) for the continuous network of GPS receivers on Kilauea and Mauna Loa volcanoes. Also shown are GPS receivers operated by the University of Hawaii. All of the GPS data are processed automatically at HVO, using scripts that were jointly developed by Stanford and HVO; RINEX files are archived at HVO and UNAVCO. The southeastward motion of Kilauea’s south flank is well expressed. This feature had been previously identified by EDM and campaign GPS measurements (Owen et al., 2000).
Figure 1. Average station velocities for the epoch 1996 to 2001.5 for permanent stations on Kilauea, with some of the Mauna Loa sites shown as well. Velocities are with respect to the Pacific Plate. The position time series (Figure 2) exhibit long-term quasi-steady rates of change, interrupted by discrete offsets at the times of intrusions (January 30, 1997, September 12, 1999), earthquake swarms (September, 19, 1998, November 21, 1999), the M 5.6 Pahala earthquake, and a silent slip event in November 2000. The data also exhibit a very large transient following the 1997 intrusion/eruption.
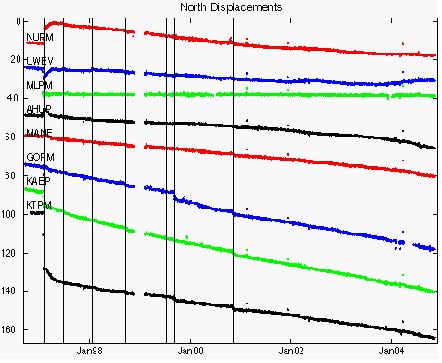
Figure 2. North component of motion for selected continuous GPS sites on Kilauea volcano. Vertical lines mark: 1) January 30, 1997 eruption and intrusion, 2) M 5.2 south flank earthquake, 3) A summit tilt event, 4) September 1998 earthquake swarm, 5) M 5.6 Pahala earthquake, 6) September 12, 1999 ERZ intrusion, 7) South flank silent earthquake. The 1997 eruption in Kilauea’s East Rift Zone (ERZ) at Napau crater was exceptionally well captured by the GPS network. The cumulative displacements spanning the eruption are shown in Figure 3. Owen et al, (2000) solved for the best fitting opening dislocation. They found the dislocation aligned with the surface fissures, was ~2m thick in good agreement with field measurements of the fissure opening, and extended from the surface to a depth of 2 to 3 km.
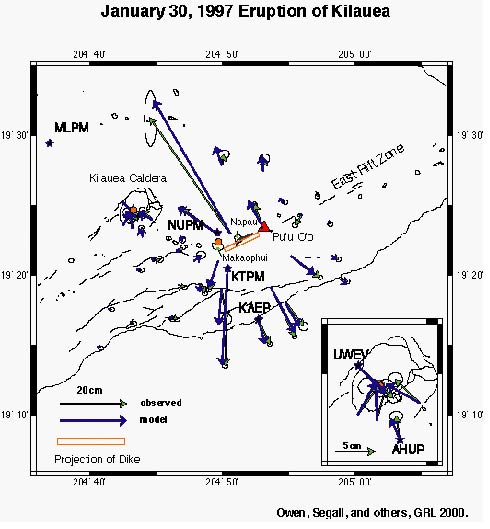
Figure 3. Displacements accompanying the 1997 eruption at Napau crater. Green vectors with error ellipses are observed displacements. Blue are model predicted. Orange rectangle is the surface projection of the best fitting dike. After Owen et al., 2000. In 1997 we had continuous GPS observations at three stations marked by stars in Figure 3: NUPM, KTPM, and KAEP. The time series of these stations (north component only) is shown in Figure 4. These data record rift opening, with NUPM, located north of the rift moving north, and the two stations south of the rift moving south (as in Figure 3). What is striking is that rift opening began simultaneously with the onset of harmonic tremor, fully 8 hours prior to the eruption. KTPM displaced roughly 17 cm prior to the eruption (Figure 4). We infer from these observations that it took 8 hours for the dike to propagate from 2.5 km depth to the surface.
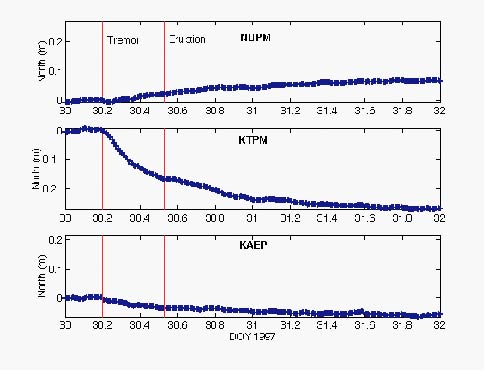
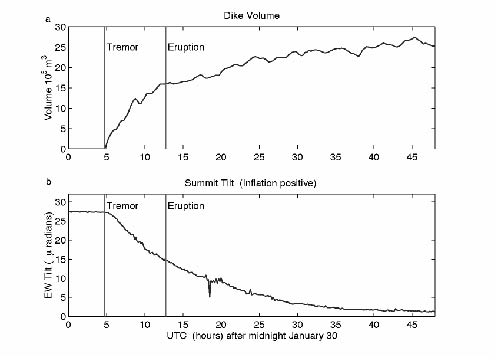
Figure 4. North component of station displacement time series for the three continuous stations during the January 30, 1997 eruption. Time is in Day of Year, 1997. First vertical line marks the onset of harmonic tremor, the second the onset of the eruption. After Segall et al., 2001. An interesting observation is that the rate of extension was initially fast but then slowed with time. Segall et al., (2001) used the data from Figure 3 to infer the dike volume as a function of time and therefore the flux of magma into the dike as it propagated. The results are shown in Figure 5. What is striking is that the volume rate slowed steadily with time following the onset of dike propagation; the final dike volume was roughly 20 million cubic meters. The decaying volume rate was not expected based on simple elastic models of a dike propagating at constant magma pressure. A clue to the explanation is found in comparing the volume flux into the dike with the deflation of the summit magma reservoir as recorded by a tilt meter. The fact that the two curves are so well anti-correlated suggests that the magma pressure was steadily decreasing as the dike propagated.
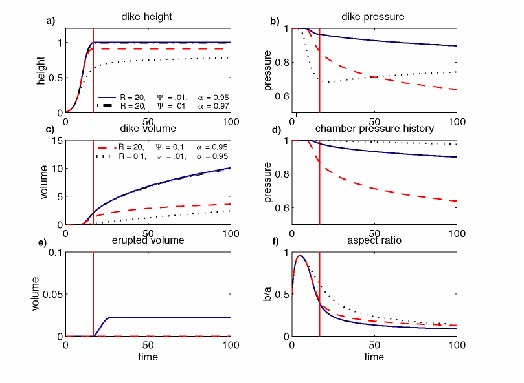
Figure 5. (a) Dike volume as a function of time as estimated from the continuous GPS data. (b) East-west component of tilt for the summit tilt meter. Lower values indicate subsidence of Kilauea’s summit and hence deflation. After Segall et al., 2001. Segall et al. (2001) developed a simple analytical model of a dike coupled to a magma reservoir. The assumptions are quite simple: that the mass of magma is conserved in the system, the mass flux between the reservoir and the dike is proportional to the pressure difference, and that the rate of dike propagation depends on the ability of magma to flow to the dike tip. Theses assumptions lead to a system of coupled equations governing the evolution of the dike-chamber system. The system behavior is governed by three dimensionless parameters: α, the ratio of hydrostatic pressure to the dike initial pressure --smaller α indicates higher magma overpressure; Ψ measures the size and compressibility of the source volume,-- smaller Ψ means a large and compressible reservoir feeding the dike; and R which is the ratio of characteristic time for dike propagation to flow between the reservoir and the dike. Numerical solutions are shown in Figure 6.
Figure 6. Numerical solutions of the governing equations for a simple coupled dike magma chamber system (a) Dike height (b) Dike pressure, (c) Dike volume, (d) Magma chamber pressure (e) erupted volume, (f) aspect ratio of dike. Small aspect ratios indicate elongate, blade-like dikes. All values are dimensionless. See Segall et al., 2001. Following the cessation of the January 1997 eruption, the GPS data record a remarkable transient deformation signal. The summit region which deflated sharply during the eruption, re-inflated in the following months. During this time the lava pond at Pu’u O’o, which drained during the eruption, returned and the lava level rose as the summit inflated. The eruption resumed there in late March 1997. The stations across the ERZ recorded a transient extension that decayed in rate with time, ultimately reaching 25% of the co-eruptive extension. Desmarais and Segall (in prep) invert these data for spatial and temporal variations in deformation within the rift zone and on the basal decollement. They find little evidence for slip on the decollement. The data can be reasonably well explained by reinflation of the summit magma reservoir and a dike-like body within the ERZ that extends uprift of the 1997 eruptive fissures. The 1997 intrusion/eruption was followed by a smaller intrusion in 1999. Deformation associated with an earthquake swarm on 12 September 1999 in the Upper East Rift Zone of Kilauea Volcano was recorded by continuous GPS receivers and by borehole tiltmeters. Analyses of campaign GPS, leveling data, and interferometric synthetic aperture radar (InSAR) data from the ERS-2 satellite also reveal significant deformation from the swarm (Cervelli et al, 2002). We interpret the swarm as resulting from a dike intrusion and model the deformation field using a constant pressure dike source. Nonlinear inversion was used to find the model that best fits the data. The optimal dike is located beneath and slightly to the west of Mauna Ulu, dips steeply toward the south, and strikes nearly east-west. It is approximately 3 by 2 km across and was driven by a pressure of 15 MPa. The total volume of the dike was 3.3 x10⁶ m3. Tilt data indicate a west to east propagation direction. Lack of premonitory inflation of Kilauea’s summit suggests a passive intrusion; that is, the immediate cause of the intrusion was probably tensile failure in the shallow crust of the Upper East Rift Zone brought about by persistent deep rifting and by continued seaward sliding of Kilauea’s south flank. Figure 7 shows the normal stress perpendicular to the dike plane caused by south flank sliding and deep rift dilation, according to the model of Owen et al, 2000. The high relative tensile stress in the vicinity of the 1999 intrusion is consistent with a passive intrusion mechanism.
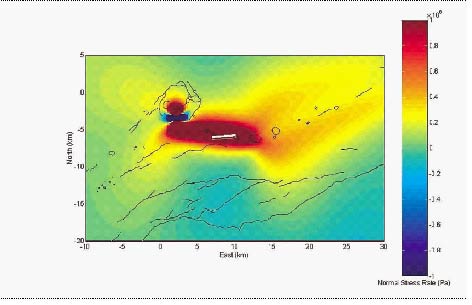
Figure 7. Magnitude of the normal stress rate on dikes in the upper east rift zone at 2 km depth with the same orientation of the 12 September 1999 intrusion. Positive normal stress rates indicate tension; negative rates indicate tension. Stress calculation based on the dislocation model of Owen et al. [2000b]. The white box is the surface projection of the 12 September 1999 dike. After Cervelli et al, 2002. Because of the frequency of deformation events on Kilauea, we have applied kinematic processing techniques to GPS data from the continuous array (Larson et al, 2001). Near real-time kinematic processing facilitates quick identification of deformation sources, information that can be used both to mitigate hazards and to plan rapid-response scientific experiments, e.g., the deployment of additional geodetic instruments. Kinematic processing also permits high-resolution temporal imaging of deformation that evolves over hours or minutes, which can be easily obscured by standard static processing techniques. High-resolution time histories are essential for any detailed mechanical analysis of rapidly evolving deformation events like a dike intrusion. To best implement the near real-time kinematic processing system, we have conducted many experiments using previously collected data. We have used these data to choose an appropriate scale parameter for the random walk stochastic model we have adopted for the station positions. We have also explored the advantages and disadvantages of temporal smoothing for near real-time processing. The various methods are tested against borehole tilt data collected at Kilauea summit. We find that for appropriate choice of scale parameter that short period noise is suppressed without inhibiting our ability to monitor transient deformation events. One of the greatest hazards associated with oceanic volcanoes, such as Kilauea, is not volcanic. Rather, it is the potential for catastrophic flank failure resulting in tsunamis, which threaten not just the immediate vicinity, but coastal cities along the entire rim of an ocean basin. In early November 2000, the Kilauea continuous GPS network recorded transient southeastward displacements, which we interpret as an episode of aseismic fault slip. The displacements are shown in Figure 8, as are the displacements from the best fitting uniform slip dislocation. This source is a shallowly dipping thrust at a depth of 4.5 km that we interpret as the down dip extension of the Hilina / Holei Pali normal fault system. Note that the model dislocation fits the observations exceptionally well. Given the size of the dislocation and the amount of slip, 87mm , one would infer the occurrence of an earthquake with moment magnitude of M5.7, yet no earthquake of anywhere near that size was recorded on Kilauea during this time (see Figure 8).
Figure 8. Observed (black) and predicted (white) displacements from the November 2000 silent slip event on Kilauea volcano. Error ellipses show 95% confidence regions. Stations in white are continuous GPS; green stations are tilt meters; red stations are strain meters. Hexagons depict seismicity from 1 to 14 November 2000; those shown in yellow have source times within 36 h of the slip event. The white rectangle is the surface projection of the best-fitting source model (a uniform slip dislocation). In order to estimate the duration of the slip event, we adopted a novel analysis method. The individual station time series are too noisy to determine significant kinematic displacements – the maximum cumulative displacement is only 2 cm. Instead, we used the GPS (double differenced) phase measurements to estimate the time variation of the slip on the dislocation directly – without going through the intermediate step of computing displacements. Of course to do so we assume that all of the deformation during this time period arises due to slip on the fault, the remainder is mapped into random benchmark motion. We found that the duration of the event was about 36 hours; it had an equivalent moment magnitude of M5.7, and a maximum slip velocity of about 6 cm/day. To test this interpretation we used the time-dependent dislocation model to predict tilt and strain records not used in the inversion (Figure 9). The fact that they fit reasonably well supports our estimate of the event duration and magnitude. This work demonstrates that continuously recording geodetic networks can detect accelerating slip, potentially leading to warnings of imminent volcanic flank collapse.
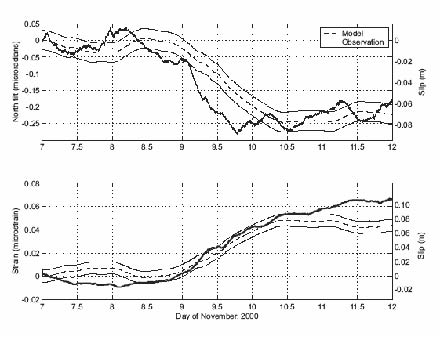
Figure 9. The source time function for November 2000 silent slip event. A) The magnitude of the slip on the model fault (right scale, dashed line) and 95% uncertainty regions (dotted line), the predicted north tilt at station ESC (left scale, dashed line) and the observed north tilt at ESC (left scale, solid line), all as functions of time. B ), Slip magnitude (right scale, dashed line) and 95% uncertainty regions (dotted line), predicted horizontal volumetric strain at STRS (left scale, dashed line) and observed volumetric strain at STRS (left scale, solid line). References
|
| Last modified
Please contact the webmaster with suggestions or comments. |
|