|
|
|
Seismicity Associated With Dike Intrusion
Dike intrusions, as well as industrial hydraulic fractures, are
commonly associated with propagating swarms of earthquakes. Some
large basaltic dike intrusions have generated tens of thousands of
seismic events and propagated tens of kilometers. Dikes have also
been imaged by ground deformation measurements including GPS,
tiltmeters, and InSAR. Deformation measurements are only weakly
sensitive to the detailed geometry of the dike, but can be used to
determine the overall dike size and volume. Seismicity, on
the other hand, is triggered by stress changes associated with the
growing crack and are therefore sensitive to the detailed shape of the
dike.
We are investigating a method for joint inversion of deformation and
seismicity data in both volcanic and hydraulic fracturing
settings. A dike is taken to be an opening mode fracture with
uniform internal pressure, but unknown shape. We model the dike with
elements that either open, and are subject to the pressure boundary
condition, or remain closed. The surface deformation is computed
from the amount of opening in each of the elements, as is the stress
change in the rock surrounding the fracture. We relate the
changes in stress to predicted changes in the rate of seismicity using
Deiterich (1994) seismicity rate theory. The binary inversion to
determine whether an element opens or not is determined by a simulated
annealing procedure, that optimizes the fit to both the deformation and
seismicity data (see movie). In simulations we have found that
joint inversion of deformation and seismicity does a better job of
recovering the input dike model than simply inverting the deformation
data alone (figure 1).
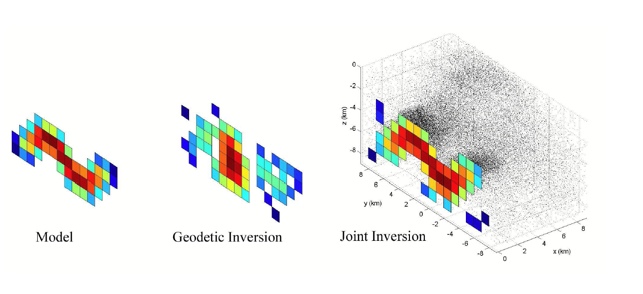
Figure 1. Invesion of geodetic data only, compared to a joint
inversion of geodetic data and seismicity data.
The space-time evolution of stress near a propagating dike or
facture can lead to important differences in the predicted seismicity.
We model an arbitrary stress history with a sum of piece-wise constant
stress-rate segments. Consider a two points, labeled 1 and 2 in
Figure 2. Point 1 is in front of the propagating dike, point 2 is
below the bottom edge of the dike. Point 1 undergoes a dramatic
increase in stress as the dike tip passes, leading to a sharp increase
in the rate of earthquakes followed by a slow (aftershock-like)
decay. Point 2 on the other hand experiences a rapid stress
increase followed by a sharp stress drop as the crack tip passes and
the volume falls into a “stress shadow”. In this case there is a
brief spurt of seismicity that stops as soon as the crack tip passes.
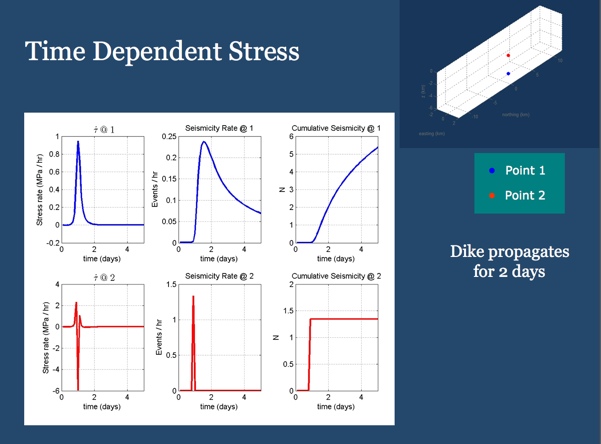
Figure 2. Point 1 (red) is offset perpendicular to the final
state of the dike, and sees a stress increase as the dike approaches
followed by a stress shadow after the dike has passed. Point 2
(blue) is below the final dike position. It sees only a stress
increase during dike propagation.
|