Modeling Time-Dependent Dike
Propagation From Seismicity and Deformation Data
Increases in seismicity and crustal deformation are two of
the most important precursors measured prior to volcanic
eruptions. Despite the fact that these observations reflect
the same physical processes at depth, the two data types are
almost never analyzed together in a quantitative way.
We focus here on dike intrusions because: a) they commonly
induce propagating swarms of earthquakes, and b) the
geometry of dikes is reasonably well understood. As a
dike is emplaced it deforms the surrounding crust. The
resulting surface deformation can be measured by continuous
GPS, tilt, and strainmeters, and InSAR. Geodetic
measurements are commonly used to constrain the overall
geometry of dikes, however they are typically insensitive of
the detailed dike shape. At the same time, stress
changes caused by the intrusion can trigger seismicity that
can potentially be used to produce a more detailed image of
the propagating dike. We have developed a method to
combine seismicity data with surface deformation in a joint
inversion to model time-dependent dike propagation.
For simplicity, we model a dike as a rectangle with a
constant height but varying length and excess magma pressure
(magma pressure exceeding the normal stress acting
perpendicular to the dike) over time. Ignoring viscous
pressure losses, the excess magma pressure can be assumed to
be uniform along the dike. We relate changes in
seismicity rate to the stress changes due to dike opening
using the seismicity-rate equations of Dieterich
(1994). These equations account for time-dependent
earthquake nucleation on faults with rate- and
state-dependent friction. Combining this forward model for
seismicity rate with geodetic Green’s functions, we use a
nonlinear least squares algorithm to invert surface
displacements and seismicity rate for changes in dike length
and excess magma pressure as a function of time. We
also constrain two of the key rate-state model parameters,
the reference stressing rate and the frictional
constitutive parameter as, which controls the temporal
evolution of seismicity rate following a stress change.
We have tested our technique by simulating noisy seismicity
and surface deformation observations for a case where a dike
propagates unilaterally at a time-varying velocity, with an
excess magma pressure that decreases over time (as would be
expected due to draining magma reservoir). The seismicity is
triggered predominantly at the edges of the dike due to the
strong stress concentrations there. We find that the
inversion procedure is able to recover the true length and
pressure histories quite well.
We are currently applying this technique to the 2007
Father’s Day dike intrusion in the East Rift Zone of Kilauea
Volcano, Hawaii, for which we have excellent seismic, GPS,
tilt and InSAR data (Figure 1). The intrusion began on
June 17 accompanied by an earthquake swarm and lasted almost
3 days, during which time seismicity propagated
down-rift. The seismicity that occurred during the
swarm is relocated and combined with GPS and tiltmeter data
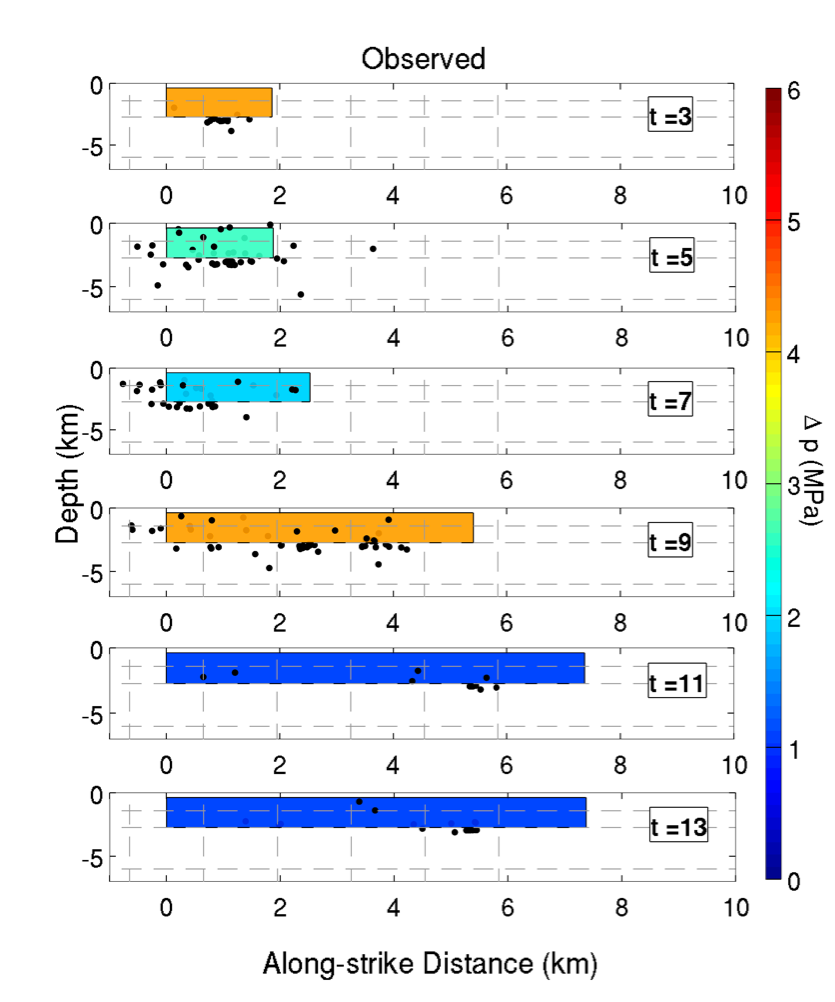
(Montgomery-Brown et al., 2011). Our preliminary
results show that the intrusion initially propagated slowly
before jumping several kilometers over a few hours, causing
the sudden down-rift migration of seismicity (Fig.
2-3). The excess dike pressure initially decreased
from about 4.5 MPa to about 2 MPa, before suddenly
increasing at t=9 when the dike propagating rapidly
down-rift. This increase in pressure appears to be
robust and may indicate that the dike tapped a second magma
reservoir at higher pressure, allowing the dike to extend
further than it otherwise would have.
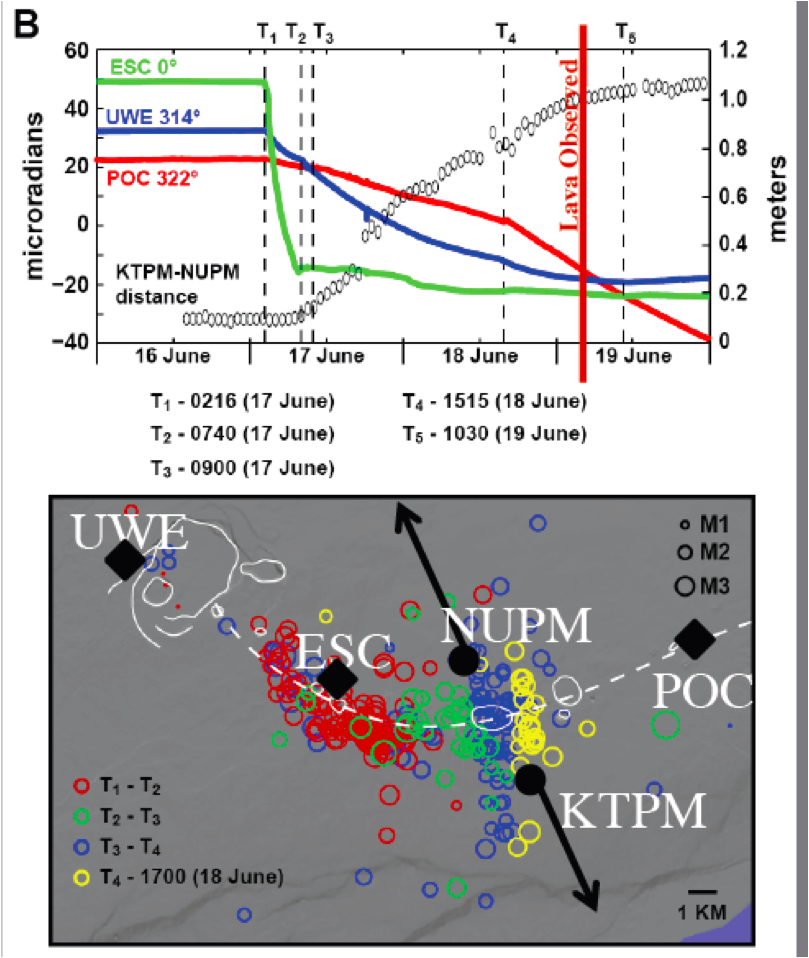
Figure
1. Time
history of the Father’s Day intrusion on Kilauea
Volcano, Hawaii. Top: Tilt of
ERZ (ESC), summit (UWE), and Pu’u ’O’o (POC) at
indicated azimuth. Distance
change between GPS stations NUPM and KTPM (open
symbols), processed at 4 minute
intervals.Bottom:
Space-time
distribution of rift zone seismicity. Summit GPS
displacements and tilts are
scaled to aid in comparing event timings; scale factors
are noted in the legend
of each frame. Vertical bars indicate the following
events: (T1) ESC and UWE
tilt begins with onset of seismicity (T2) ESC tilt
flattens, seismicity
concentrates down-rift (T3) seismicity concentrates
down-rift, summit tilt rate
increases (T4) slight increase in tilt rate at UWE and
down-rift concentration
of seismicity (T5) summit tilt returns to inflation
(After Poland et al, Montgomery-Brown
et al, 2010).
Figure
2. Preliminary inversion results for the 2007 Kilauea
dike intrusion, showing
dike length and excess pressure (color) at different
time steps.The
black dots in indicate earthquake
projected onto the plate of the dike.
Figure
3. Map view at different time steps of estimated dike
length (thin black line), seismicity (blue dots),
observed cumulative
displacement (solid black vectors) and tilt (dashed
black vector). Predicted
displacement and tilt are shown in red.
Last modified
Please contact the webmaster
with suggestions or comments.