| Search | | People | | Calendar | | Internal Resources | | Home |

Crustal Deformation and Fault Mechanics |
 |
|
|||||||||
|
|
||||||||
|
Co-shocks to Silent EarthquakesWe have identified a sequence of slow slip events (a.k.a.
silent earthquakes) beneath the south flank of Kilauea volcano, Hawaii
using a network of GPS receivers (Cervelli et al, Nature, 2002; Segall
et al, Nature, 2006). These events are not completely aseismic,
but are in fact associated with swarms of microearthquakes.
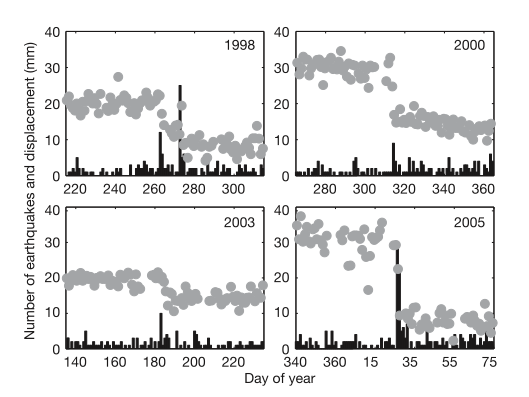
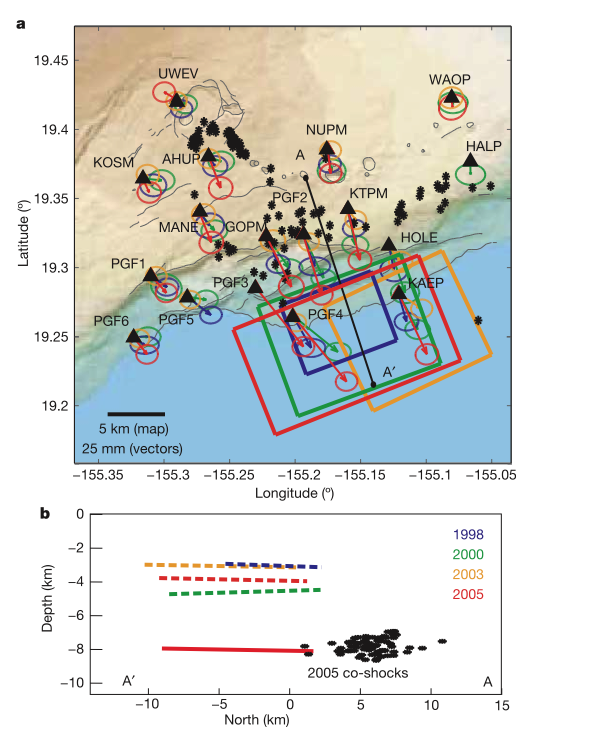
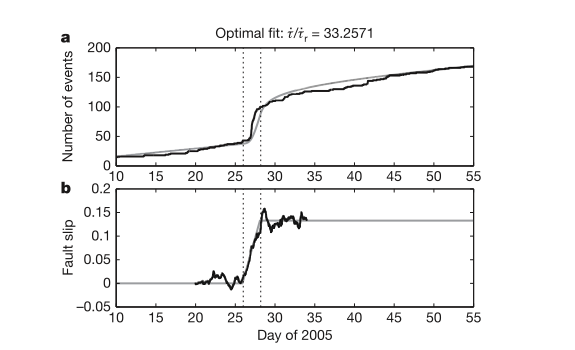
Slow earthquakes are a relatively new phenomenon, but are now observed in many subduction zones around the world. We discovered slow slip events beneath Kilauea volcano in 1992 and now recognize that they repeat in the same area on an irregular basis. Kilauea is one of the few places where silent slip events are observed to correlate with enhanced earthquake activity. The associated seismicity is located immediately adjacent to the area where the slow slip events are inferred to take place based on inversion of the GPS data (Figure 2). A number of questions immediately arise: Are the slow slip events triggering the small earthquakes? If so could they trigger a bigger event (a magnitude 7.6 earthquake and tsunami occurred in this area in 1972)? Or, are the small quakes unpinning the fault and allowing it to slip. To answer this we needed to determine the relative timing of the slip and the quakes. To address this we developed a novel method (Cervelli et al, 2002) to invert for the time dependent fault slip during the slow slip events directly from the GPS phase observations. Note that this approach bypassed the standard GPS software used to estimate receiver coordinates and went directly to fault slip. Based on these inversions we determined that the larger events last between 1.5 - 2.2 days. Importantly, we find that the slip always begins before the seismicity (Figure 3). We were able to employ a theory due to Deiterich (1994) that relates stress changes to changes in seismicity rate, and show that the time dependence of the earthquakes are consistent with them being “co-shocks” and aftershocks of the otherwise silent slip events (Figure 3).
Another question that arose is whether the slow slip events occurred on the inferred decollement beneath Kilauea, at the interface between the volcanic pile and the χCretaceous sea floor. This decollement is thought to be the source of the 1972 M 7.6 earthquake. Uniform-slip half-space inversions place the slow slip sources at shallow depths (~5 km) as in Figure 2, dashed. However, the stress field induced by these dislocations does not agree with the depths of the well-located microearthquakes (6.5 - 8.5 km), which must occur in a zone of increased Coulomb stress. Recent Ph.D. Emily Montgomery-Brown has shown that accounting for the effects of topography and layered elastic structure in the inversions can reconcile the depth of the slow earthquakes and their co- and aftershocks.
|
| Last modified
Please contact the webmaster with suggestions or comments. |
|