Incoherent high frequency seismic waves are ubiquitous in strong ground motion records. Waves with frequencies greater than 1 Hz are of particular interest to earthquake engineers as the resonance frequencies of most man-made structures (with the exception of tall buildings) fall within this high frequency range. Seismic data reveals that earthquake ruptures excite waves of all wavelengths, and that these waves become increasingly more incoherent at high frequencies. What causes this?
We are investigating the idea that high frequency waves are generated by irregular rupture propagation due to geometrical complexity of faults. In particular, recent high resolution LiDAR studies show that natural fault surfaces are rough at all scales. Slip on nonplanar faults generates huge stress perturbations that can either accelerate or decelerate the rupture as it propagates. This process releases bursts of seismic waves with wavelengths comparable to the size of the nonplanar features.
|
|
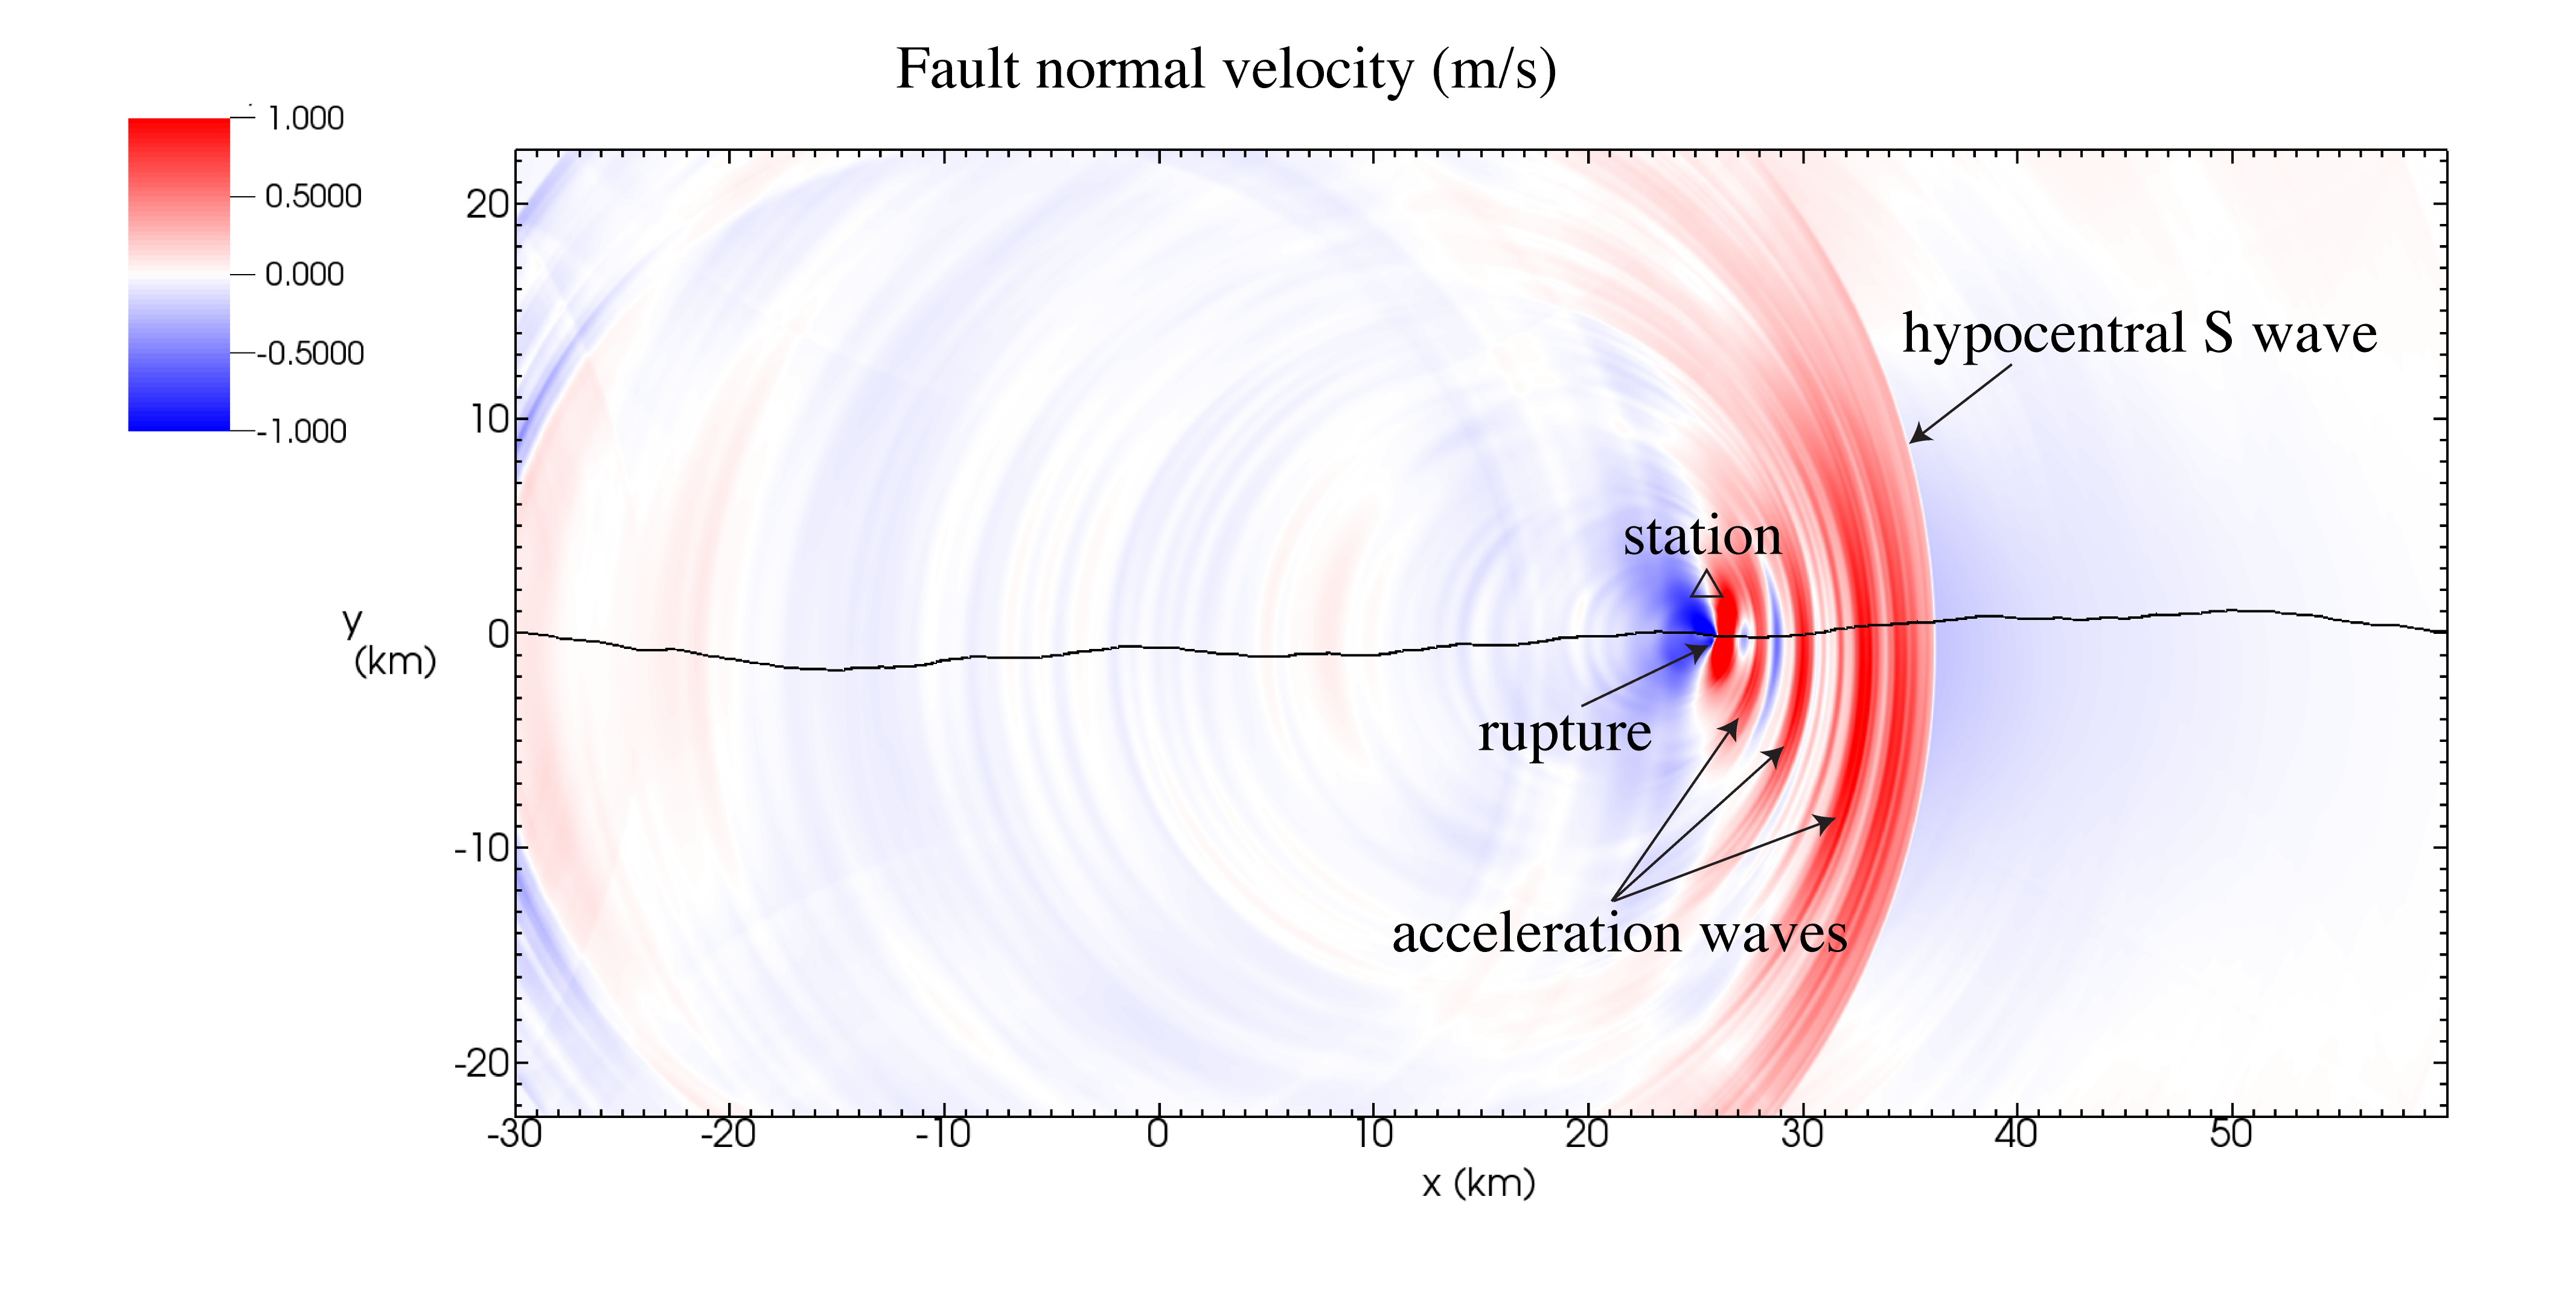
| Fig. 1: Ground motion from a rough fault model. The fault profile is a band-limited self-similar fractal curve. Click on the figure to watch a movie showing how high frequency seismic waves are generated as the rupture accelerates and decelerates. |
|
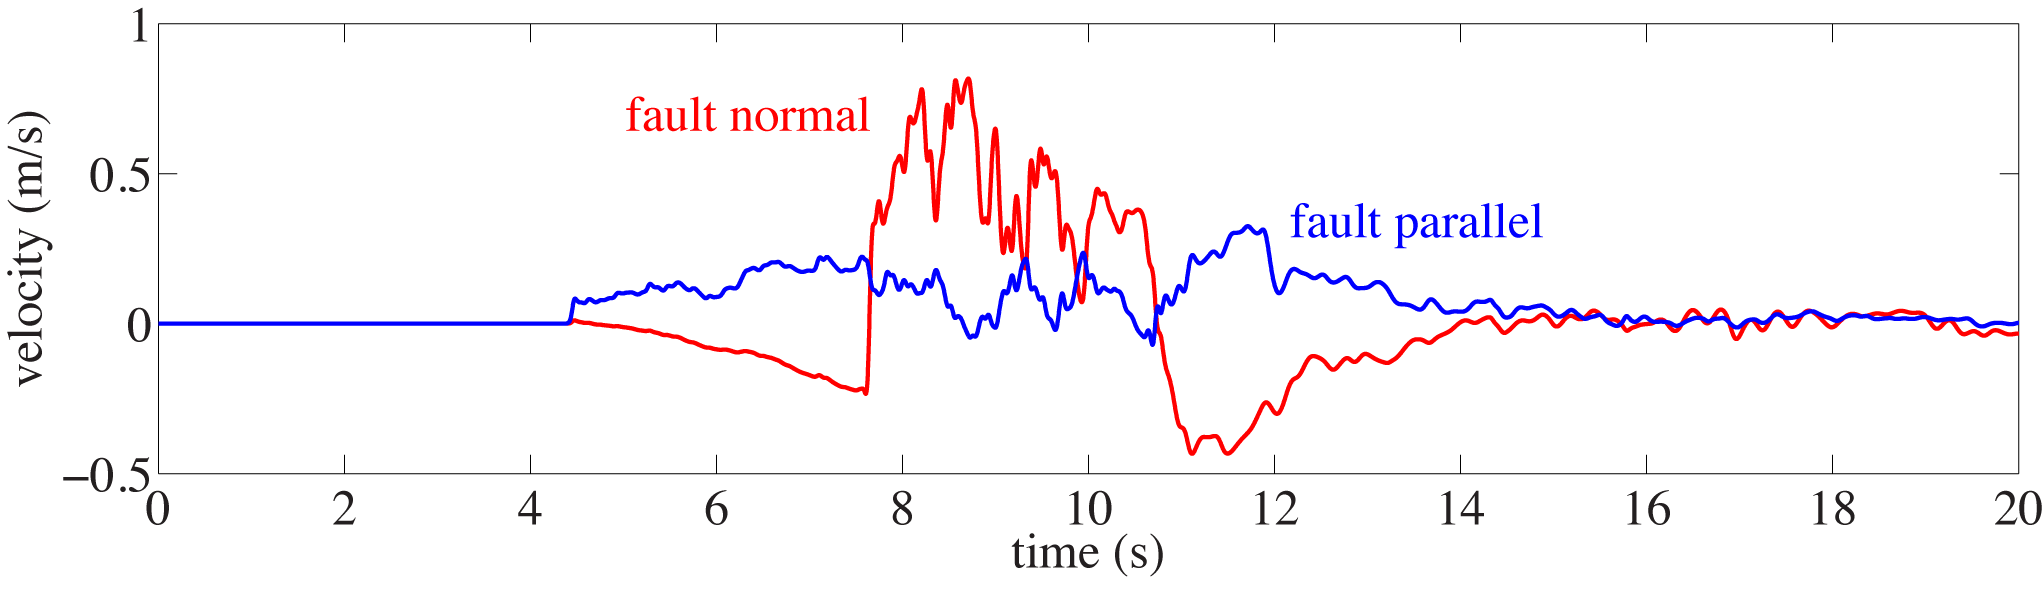
| Fig. 2: Velocity seismograms from the station shown in Fig. 1. |
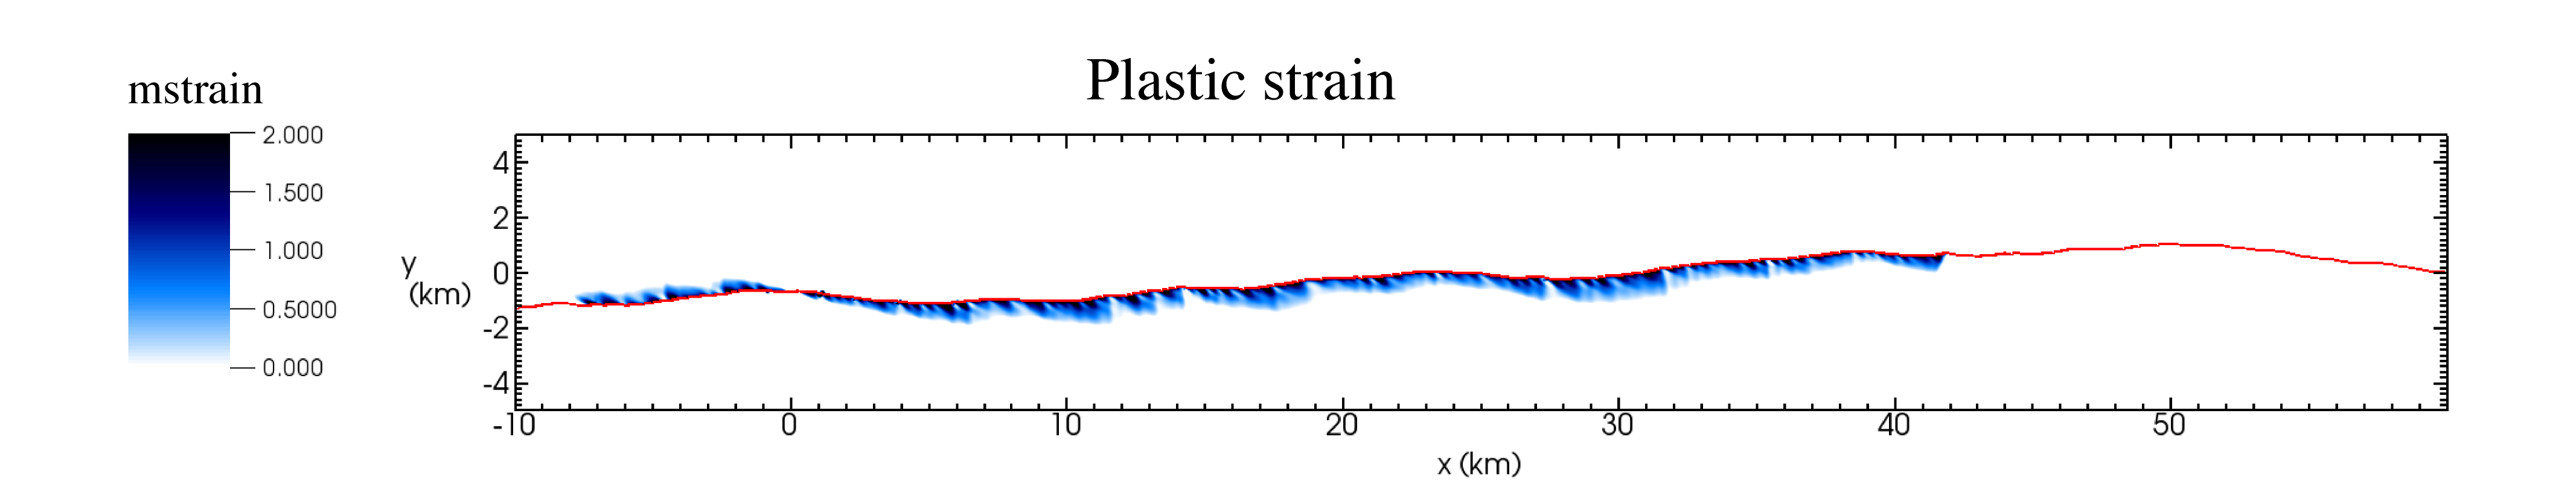
Provided that the off-fault material response remains ideally elastic, the magnitude of the stress perturbations can, especially at short wavelengths, exceed the lithostatic load. Models making the elastic assumption consequently predict large-scale fault opening and stress states far above those for which elastic behavior is observed in laboratory experiments. These models are clearly unphysical. Instead, inelastic deformation, associated with irrecoverable dissipation of energy, ensues. Natural faults are surrounded by zones of heavily fractured rock; these damage zones, as well as secondary fault branches, are possibly the geologic signature of this inelastic deformation process. In our models, we use continuum plasticity to account for this.
|
| Fig. 3: Distribution of plastic strain after an earthquake on a nonplanar fault. |