Hydraulic Fracture Diagnostics
Hydraulic fracturing is widely used to facilitate production of hydrocarbon resources in unconventional reservoirs. A current challenge is constraining the fracture geometry. We are exploring ways to use various types of waves to inter fracture geometry. The first part of our effort focuses on Krauklis or crack waves, guided waves that propagate along fluid-filled fractures (see Fig. 1 for details).
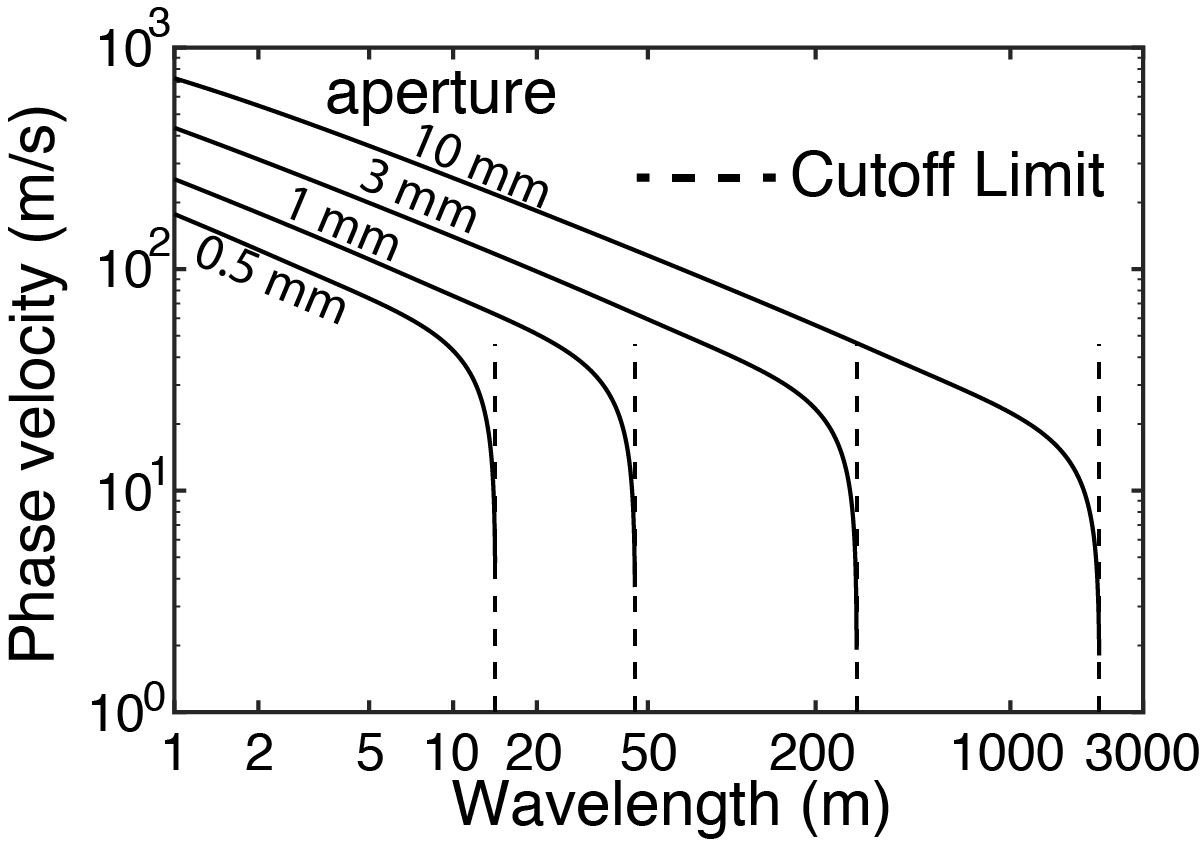 Fig. 1: Phase velocity of Krauklis waves (example for water-filled fractures in rock). Waves involve inertia (residing in the fluid for Krauklis waves) and some restoring force. In sound waves, the restoring force comes from expanding and compressing the fluid. In contrast, for Krauklis waves, elasticity from opening and closing of the crack provides the restoring force. This leads to unique dispersion properties that provide sensitivity to fracture aperture. Krauklis waves are attenuated by fluid viscosity (as well as seismic radiation at fracture tips and irregularities along the fracture walls). This attenuation prevents propagation of long-wavelength Krauklis waves, as indicated by the vertical dashed lines marked "cutoff limit."
|
Resonance of Krauklis waves occurs at a specific set of frequencies determined by the fracture geometry. We use analytical dispersion relations and numerical simulations (see example in Fig. 2) to quantify the frequencies and decay rates of fracture resonant modes. This information can be distilled into a simple graphical procedure for geometry inference (Fig. 3).
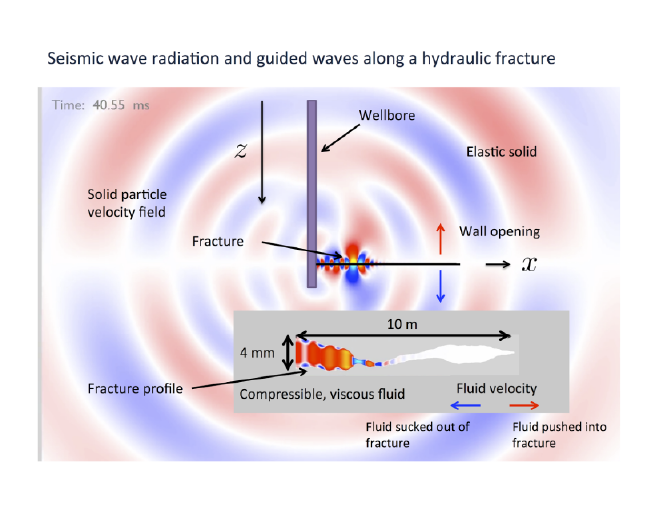 Fig. 2: Numerical simulation of wave propagation in and around a fluid-filled fracture. We use a high-order finite difference method to solve the elastic wave equation (in the solid) coupled to an approximation to the linearized compressible Navier-Stokes equation (in the fluid). The approximation, similar in spirit to the well-known lubrication approximation but accounting for compressibility and making no assumption about the fluid velocity profile, permits highly efficient numerical solution to the governing equations. Colors in the solid show velocity normal to the fracture; discontinuity in colors across the fracture indicates opening/closing motions of the fracture walls associated with Krauklis waves. Colors in the fluid show velocity along the fracture; note narrow viscous boundary layers near the fracture walls.
|
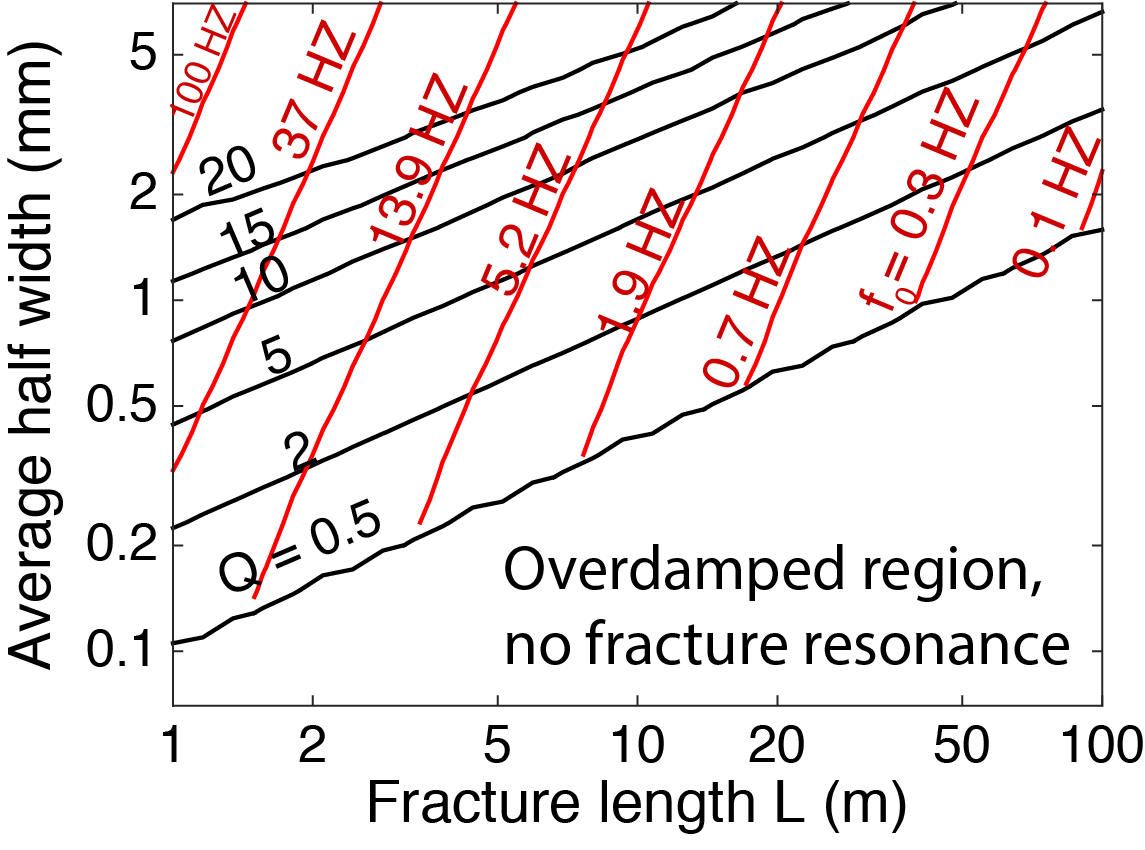 Fig. 3: Graphical method for inferring fracture geometry from Krauklis wave resonance. The axes show fracture length and width. Red lines are contours of resonance frequency f. Black lines are contours of quality factor Q (a dimensionless measure of the decay rate of the resonant response); high Q indicates long-lasting resonance. An observation of (f,Q) corresponds to a point on this graph, and the geometry can be read from the axes.
|
In an extension of this project, we are studying fractures that are hydraulically connected to a wellbore. Waves within the wellbore, known as tube waves, reflect and transmit from fractures. The reflection/transmission coefficients depend on frequency, with maximum reflection at the fracture's resonant frequencies. Thus measurements of tube waves within the wellbore might be used to indirectly constrain fracture geometry.
work with PhD students Chao Liang and Ossian O'Reilly, in collaboration with Dan Moos (former at Baker Hughes)
homepage
Last updated: September 1, 2016