Figure 1: Phase diagram of a typical retrograde gas with line of isothermal reduction of reservoir pressure for a two-component methane-butane gas-condensate.
Gas-condensate is a kind of hydrocarbon fluid that has a phase diagram as in Figure 1. In this case, the reservoir temperature lies between the critical temperature and the cricondentherm. Initially, the reservoir pressure is at a point that is above the dew point curve so the reservoir is in the gaseous state only. The gas usually consists of mainly methane and other light hydrocarbons but can also contain heavier components. During production, the reservoir pressure declines isothermally. At the dew point, liquid starts to condense. If the reservoir pressure decreases further, more liquid is condensed in the reservoir. A gas-condensate reservoir is special in the sense that when the pressure decreases, instead of having gas evolution, we have liquid condensation.
Figure 1: Phase diagram of a typical retrograde gas with line of isothermal reduction of reservoir pressure for a two-component methane-butane gas-condensate.
When the condensate drops out in the reservoir, at first, the liquid will not flow until the accumulated liquid saturation exceeds the critical saturation. The fluid distribution in the well can be divided into three regions as shown in Figure 2 (Fevang and Whitson, SPE Reservoir Engineering, pp 221–230, 1996) .
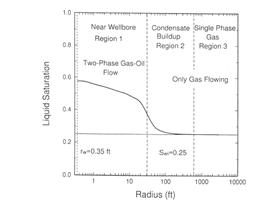
Figure 2: Three region of flow behavior in a gas condensate well (Fevang and Whitson, SPE Reservoir Engineering, pp 221–230,1996)
Near the wellbore, the condensate saturation is higher; so the gas relative permeability is lower. The reduction of gas permeability due to the condensate bank is called condensate blocking. These effects lead to a loss in the productivity of the well. The productivity loss is large in some case. For example, the productivity loss in some wells in Arun field is greater than 50% (Afidick, D., Kaczorowski, N., and Bette, S.,1994, “Production Performance of a Retrograde Gas: A Case Study of the Arun Field”, in SPE Asia Pacific Oil and Gas Conference, Melbourne, Australia. SPE 28749).
The objective of this research is to gain a better understanding of how the condensate blocking and reduction in the relative permeability affects the well productivity with the focus on the flow behavior analysis. This is important for optimizing the producing strategy for gas-condensate reservoirs, reducing the impact of condensate banking, and improving the ultimate gas and condensate recovery.
To investigate the composition change resulting from condensation due to the pressure variation and the condensate hold-up due to relative permeability effect, we needed to select an appropriate gas-condensate mixture to conduct the core flooding experiment.
In this study, we chose a binary component gas-condensate mixture based on the following principles:
Figure 1 showed the phase envelope for a binary gas-condensate mixture which satisfies the four principles mentioned. This system is composed of a mix of 85% methane and 15% n-butane. At a temperature of 20 degC and a pressure from 130 atm to 70 atm, this phase diagram has a good retrograde region.
The apparatus built to performed experiment is showed in Figure 3. The equipment consists of four subsystems: the gas supply and exhaust system, the core flow system, fluid sampling and data acquisition system.
Figure 3: Experiment apparatus.
The upstream gas mixture is stored in a piston cylinder (HaiAn,China, capacity 4,000 ml, pressure range 0-4641 psi), and the cylinder pressure is controlled by a high pressure nitrogen cylinder (6000 psi). The downstream gas exhaust was discharged to a fume hood directly in the constant pressure drop experiment since the total volume of the exhaust is very small and safe to dilute into the atmosphere. After the buildup test, the core was discharged into another empty piston cylinder, so that the collected fluid could be analyzed to determine the total composition.
The core flow system consists of a titanium core-holder (Shiyi Science and Technology, model J300-01, Figure 4), which can support a maximum confining pressure 5800 psi), while maintaining the pore pressure at 5366 psi. The high pressure titanium core holder has six ports along its length to allow for pressure monitoring and fluid sampling. A homogeneous Berea sandstone core was selected for this experiment. The core has a length of 30 cm and a diameter of 5.06 cm with an average porosity around 15% and an average absolute permeability about 5 md. The choice of permeability was intentional, as it was necessary to produce pressure drops of suitable magnitude to create the desired condensation region during flow.
Figure 4: High pressure titanium core holder.
One of the unusual aspects of this experiment is the ability to measure the in-place composition. The in-place composition samples are collected with Tedlar gas sampling bags (SKCwest, model 232-02; Figure 5) attached to the six sampling ports along the core-holder
Figure 5: Sampling system.
All pressure measurements are recorded and displayed electronically using a high-speed data acquisition system (Figure 6).
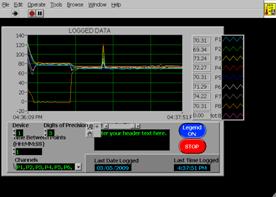
Figure 6: Data acquisition system.
The composition of the gas mixture is analyzed using the Agilent GC analyzer (Figure 7(a)). A typical chromatograph of the C1/n-C4 is showed in Figure 7(b).
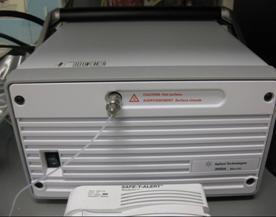
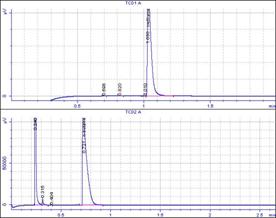
Figure 7: (a) Agilent GC analyzer; (b) A typical chromatograph of C1/n-C4 gas mixture.
An X-ray computed tomography (CT) scanner (GE HiSpeed CT/I; Figure 8(a)) was used in this study to measure the static saturation in the core. The scanner can also be used to monitor dynamic experiments, such as core floods as the two phases develop in the core.
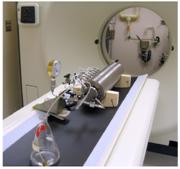
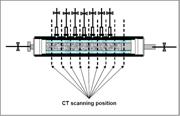
Figure 8: (a) GE HiSpeed CT/I scanner; (b) scanning positions.
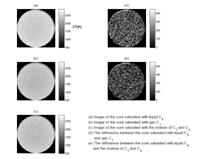
Figure 9: CT images of the core saturated with (a) liquid butane (b) gas methane (c) the mixture of methane and butane and (d) the difference between liquid butane and gas methane and (e) the difference between liquid butane and the mixture of methane and butane.
Compositional simulations of binary and multicomponent gas-condensate systems were performed to investigate how the producing strategies influence the total gas production and compositional variation in both the well block and the well-head flow.
"Flow Behavior of Gas-Condensate Wells", Ph.D. dissertation, Chunmei Shi, February 2009.
"Flow Behavior of Gas-Condensate Wells", M.S. thesis, Chunmei Shi, June 2005.
"Well Testing in Gas-Condensate Reservoirs", M.S. thesis, Rajeev Lal, June 2003.
"Well Test Analysis of Gas Condensate Wells", M.S. thesis, Bruno Roussennac, March 2001.